Your company already knows the answer. Now you can ask it.
Company Brain is a graph database of your whole organisation: your reports, records and project data in one place your AI can use, along with meetings, emails, spreadsheets and the things in people's heads. Ask a question in plain English and get the answer with the evidence behind it. Built and run for your organisation by GIS Analytics.
From first briefing to a working record.
Scope
A one-hour briefing, then a written scope: the questions your business needs answered, the records that answer them, and the measures we will compare before and after.
Build
We map your organisation into the graph. AI proposes the structure and the connections; your people inspect and correct them before anything is relied on.
Run
We operate it for you. New records keep arriving, nothing is written to your record until a person approves it, and every answer traces back to its source.
Report
You see the difference against the baseline agreed at scoping, measure by measure.
In daily use at


 Dept of Information Studies
Built for <teams>
that have to show
their working
Most tools give you an answer. Company Brain gives you the answer and the trail behind it: which document, whose report, which decision it followed from, and who approved it.
That is the difference between an assistant you have to double-check and a record you can hand to a board, a client, or an auditor.
Institutional memory, with structure.
Company Brain gives you one connected record of your people, clients, projects, decisions and the evidence behind them, built from the documents you already produce.
It records not just what was decided but why: who proposed it, what evidence supported or contradicted it, what followed. You can ask in plain English. The audit trail assembles itself.
One shared memory
Data-based decision making
A trail that writes itself
Transcripts, email, exports and notes become structured records. Each one keeps a link back to the document it came from.
Everything gets linked to whatever it relates to. The result looks like your business, not a database.
A question pulls in everything connected to it: prior context, and the evidence for and against. The answer arrives with its sources attached.
Recommendations become actions, and every outcome links back to the decision that produced it.
One connected map of how the business runs.
This is the real viewer, embedded live. It shows a made-up example company: its people, clients, projects, decisions, evidence, and how they all connect.
About this data: the company shown is made up. Nothing about a client business appears on this site.
Specific Q&A
Ask a question, get the answer with its evidence attached: who decided, when, and on what basis. Not a document search: the answer comes from what the company actually knows.
Qualitative advice
Recommendations argued from the firm's own context: prior decisions, commitments, cash position, with supporting and contradicting evidence attached.
Simulations
See the knock-on effects before they happen: which projects, people and revenue are exposed, traced along the firm's real relationships rather than guesswork.
Company check-up
A structured review of the graph itself: stale decisions, contradicted evidence, orphaned actions, concentration risk. The business, audited by its own structure.
A working session with GIS Analytics takes one hour: we map a slice of your company into the graph, and you ask it questions.
 In the real world
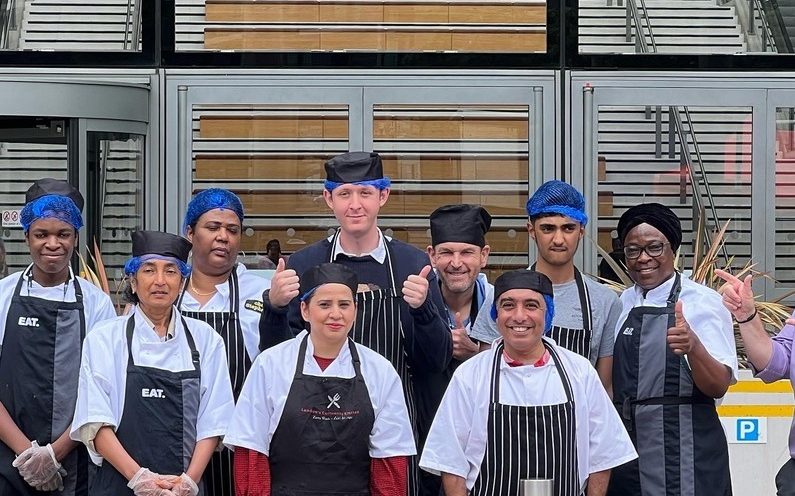
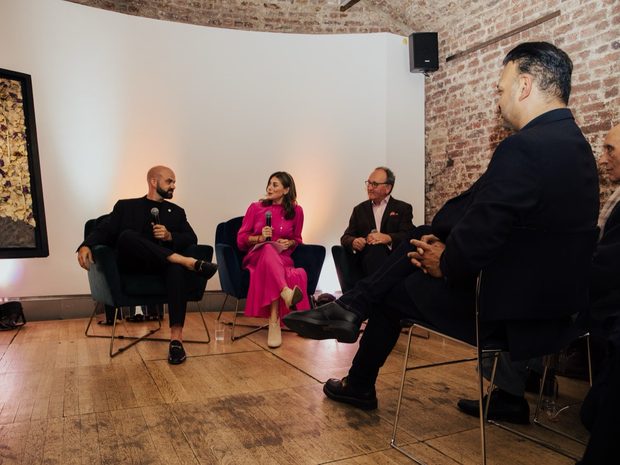
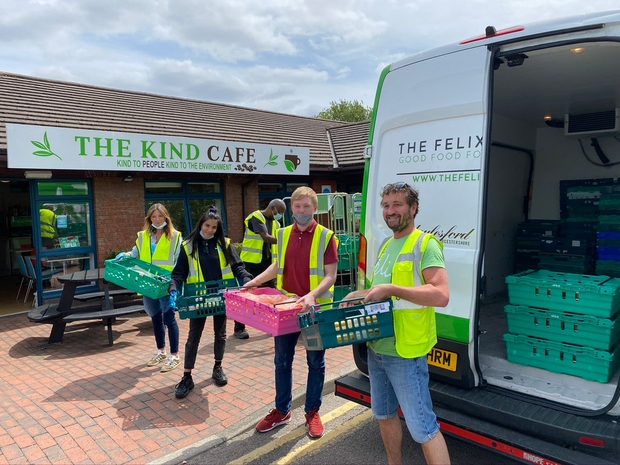
The graph changed the way we see the whole operation. For the first time we can look at the entire ecosystem in one place, how our kitchens, projects and partners connect, and act on it.
 Taz Khan MBE · Founder, London's Community Kitchen
London's Community Kitchen runs a café, a water brand, a youth academy and a climate hub, all in service of one food-security mission. We mapped the programmes, partners, decisions and the evidence behind them into one connected picture.
- 778nodes in their graph
- 4ventures in one graph
- First clientoutside our own walls
Answers you can take to a review.
Each decision is a first-class node linked to its context, its evidence on both sides, the people involved and the actions that followed. The audit trail is not written after the fact; it is the shape of the data.
Property graph, not RDF.
The data model treats nodes and relationships as first-class objects, each carrying properties of its own. It is close to how a founder describes their business: this client, on this project, with that contract.
The choice was made early, in consultation with the UCL team: property graphs trade some of RDF's semantic rigour for queryability, tooling maturity and a model the team can extend without recompiling an ontology.
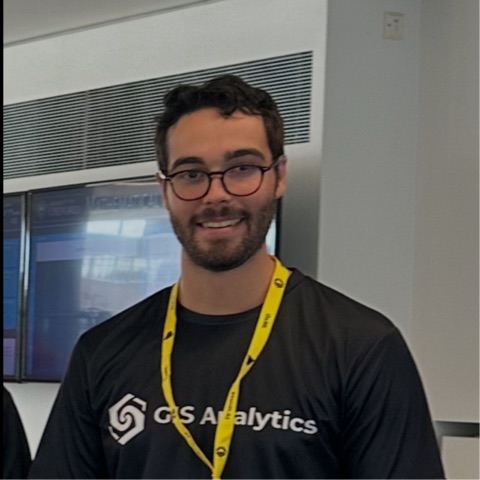

 Dept of Information Studies · not GIS Analytics staff


Register your interest.
We scope Company Brain with each organisation, build it on its records and run it. Leave your work email and we will be in touch to arrange a one-hour briefing, where we map a slice of your organisation into the graph and you question it. Academic groups with adjacent work, and funders looking at this space, are welcome too.